Mean of Ungrouped Data


Mean of Ungrouped Data
Mean of Ungrouped Data:
The most common representative value of a group of data is the arithmetic mean.To understand this let us take the following example:
Two vessels contain 20 litres and 60 litres of milk respectively. What is the amount that each vessel would have, if both share the milk equally? When we ask this question we are seeking the arithmetic mean. In this case, the average or the arithmetic mean would be
Thus, each vessels would have 40 litres of milk.
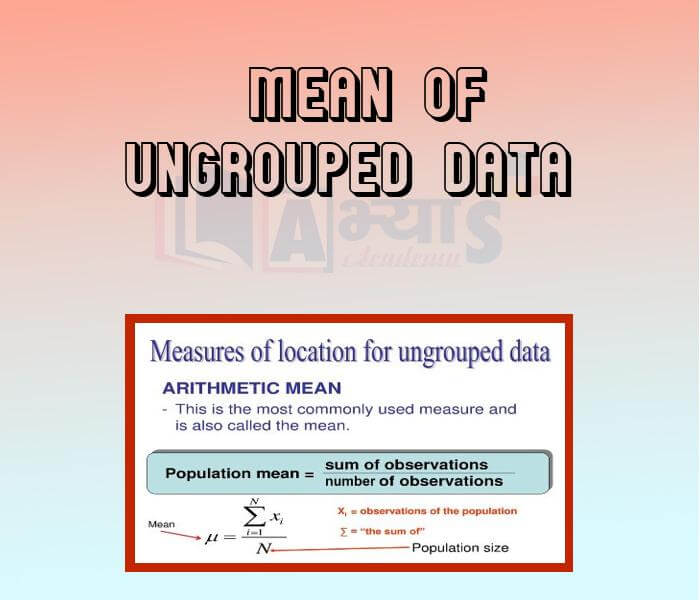
The average or Arithmetic Mean (A.M) or simply means defined as follows:
Illustration 1: Ashish studies for 4 hours, 5 hours and 3 hours respectively on three consecutive days. How many hours does he study daily on an average?
Solution: The average study time of Ashish would be
Thus, we can say that Ashish studies for 4 hours daily on an average.
Thus, the mean for ungrouped data is obtained by dividing the sum of all values by the number of values in the data set. The mean of data indicate how the data are distributed around the central part of the distribution.
Mean Of Raw Data: The mean (or arithmetic mean) of n observations (variates) is given by
Illustration 2: A student scored 80%, 72%, 50%, 64% and 74% marks in five subjects in an examination. Find the mean percentage of marks obtained by him.
Solution: Here, observations in percentage are x1 = 80, x2 = 72, x3 = 50, x4 = 64 and x5 = 74 . Therefore, their
The sum of 12 observations is 600, then the mean value is ________________. | |||
| Right Option : C | |||
| View Explanation |
The mean of the given data 16, 18, 19, 21, 23, 23, 27, 29, 29, 35 is _________________. | |||
| Right Option : A | |||
| View Explanation | |||
The mean of the data : 9, 7, 11, 13, 2, 4, 5, 5 is _______________ | |||
| Right Option : B | |||
| View Explanation | |||
Students / Parents Reviews [10]
My experience with Abhyas is very good. I have learnt many things here like vedic maths and reasoning also. Teachers here first take our doubts and then there are assignments to verify our weak points.

Shivam Rana
7thIt has a great methodology. Students here can get analysis to their test quickly.We can learn easily through PPTs and the testing methods are good. We know that where we have to practice

Barkha Arora
10thBeing a parent, I saw my daughter improvement in her studies by seeing a good result in all day to day compititive exam TMO, NSO, IEO etc and as well as studies. I have got a fruitful result from my daughter.

Prisha Gupta
8thAbout Abhyas metholodology the teachers are very nice and hardworking toward students.The Centre Head Mrs Anu Sethi is also a brilliant teacher.Abhyas has taught me how to overcome problems and has always taken my doubts and suppoeted me.

Shreya Shrivastava
8thAbhyas is a complete education Institute. Here extreme care is taken by teacher with the help of regular exam. Extra classes also conducted by the institute, if the student is weak.

Om Umang
10thIt was a good experience with Abhyas Academy. I even faced problems in starting but slowly and steadily overcomed. Especially reasoning classes helped me a lot.

Cheshta
10thAbhyas Methodology is very good. It is based on according to student and each child manages accordingly to its properly. Methodology has improved the abilities of students to shine them in future.

Manish Kumar
10thMy experience was very good with Abhyas academy. I am studying here from 6th class and I am satisfied by its results in my life. I improved a lot here ahead of school syllabus.

Ayan Ghosh
8thOne of the best institutes to develope a child interest in studies.Provides SST and English knowledge also unlike other institutes. Teachers are co operative and friendly online tests andPPT develope practical knowledge also.

Aman Kumar Shrivastava
10thA marvelous experience with Abhyas. I am glad to share that my ward has achieved more than enough at the Ambala ABHYAS centre. Years have passed on and more and more he has gained. May the centre flourish and develop day by day by the grace of God.